Tools to measure time spent in your Maven builds.
By default Maven measure and display per module and total build time without further details. Hopefully you can use third party tools to profile each executions within your build.
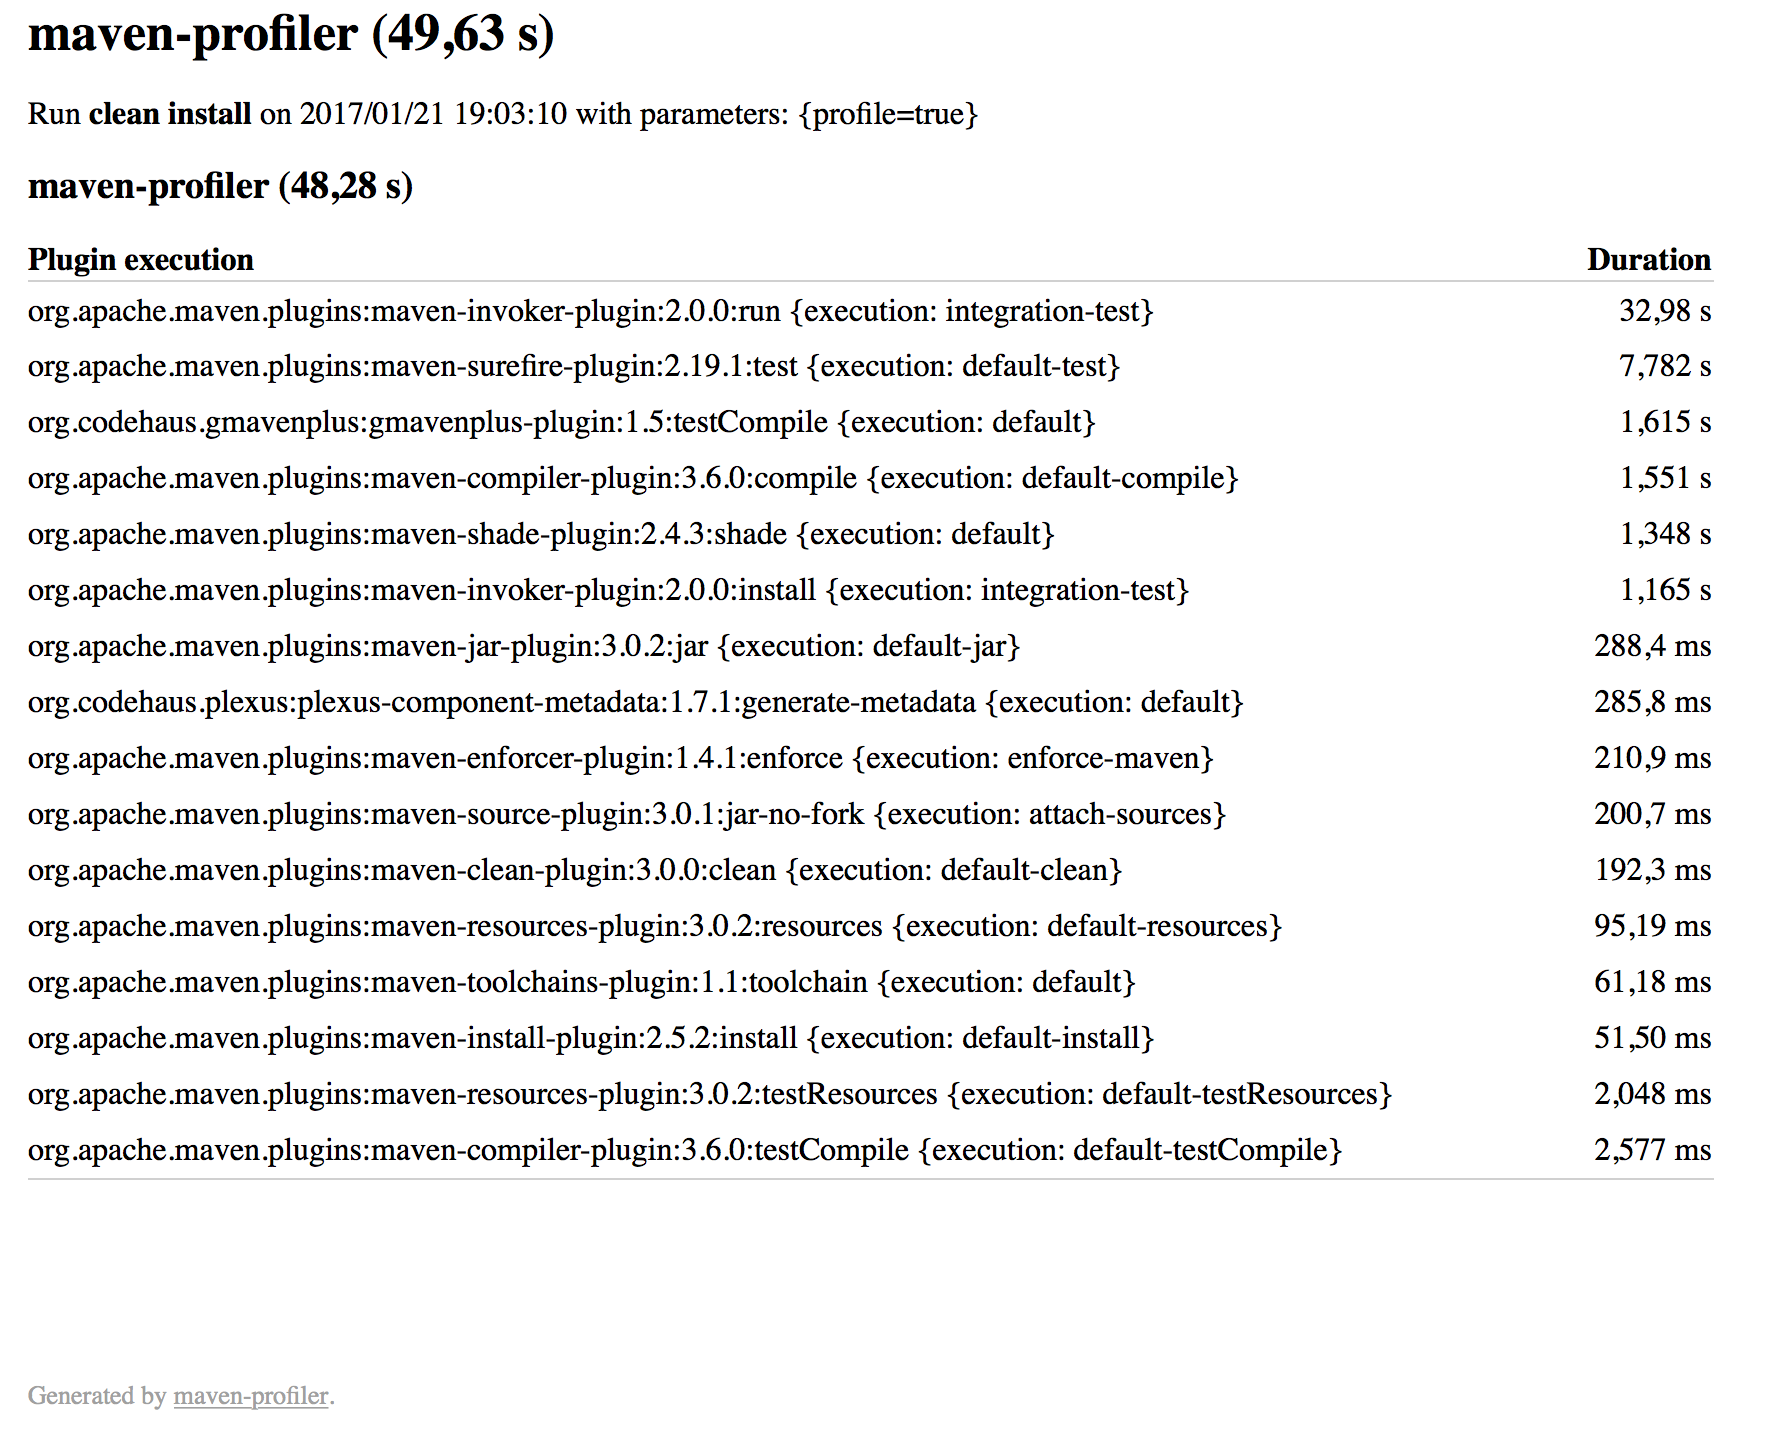
maven-profiler
A tool I wrote some time ago because I didn’t find what I want. I use it to find which step is consuming most of the time and try to reduce the execution time.
It can generate a report (HTML or JSON) written in the .profiler folder inside the project.
To install it follow instructions available on github.
The report is created when we launch a build with the system property profile:
mvn install -Dprofile
By default, the HTML report is used, to switch for the JSON one:
mvn install -Dprofile -DprofileFormat=JSON
Report example:
{
"name": "maven-profiler",
"goals": "clean install",
"date": "2015/01/17 15:28:49",
"parameters": "{profile=true, profileFormat=JSON}",
"projects": [{
"project": "maven-profiler",
"time": "6.793 s",
"mojos": [{
"mojo": "org.apache.maven.plugins:maven-surefire-plugin:2.18:test {execution: default-test}",
"time": "2.512 s"
}, {
"mojo": "org.apache.maven.plugins:maven-shade-plugin:2.3:shade {execution: default}",
"time": "1.458 s"
}, {
"mojo": "org.codehaus.gmavenplus:gmavenplus-plugin:1.2:testCompile {execution: default}",
"time": "818.3 ms"
}, {
"mojo": "org.apache.maven.plugins:maven-compiler-plugin:3.2:compile {execution: default-compile}",
"time": "538.7 ms"
}, {
"mojo": "org.apache.maven.plugins:maven-source-plugin:2.4:jar-no-fork {execution: attach-sources}",
"time": "248.5 ms"
}, {
"mojo": "org.apache.maven.plugins:maven-jar-plugin:2.5:jar {execution: default-jar}",
"time": "238.2 ms"
}, {
"mojo": "org.apache.maven.plugins:maven-resources-plugin:2.7:resources {execution: default-resources}",
"time": "171.7 ms"
}, {
"mojo": "org.codehaus.plexus:plexus-component-metadata:1.6:generate-metadata {execution: default}",
"time": "170.5 ms"
}, {
"mojo": "org.apache.maven.plugins:maven-enforcer-plugin:1.2:enforce {execution: enforce-maven}",
"time": "126.0 ms"
}, {
"mojo": "org.apache.maven.plugins:maven-clean-plugin:2.6.1:clean {execution: default-clean}",
"time": "76.11 ms"
}, {
"mojo": "org.apache.maven.plugins:maven-install-plugin:2.5.2:install {execution: default-install}",
"time": "53.95 ms"
}, {
"mojo": "org.apache.maven.plugins:maven-compiler-plugin:3.2:testCompile {execution: default-testCompile}",
"time": "2.850 ms"
}, {
"mojo": "org.apache.maven.plugins:maven-resources-plugin:2.7:testResources {execution: default-testResources}",
"time": "2.518 ms"
}]
}]
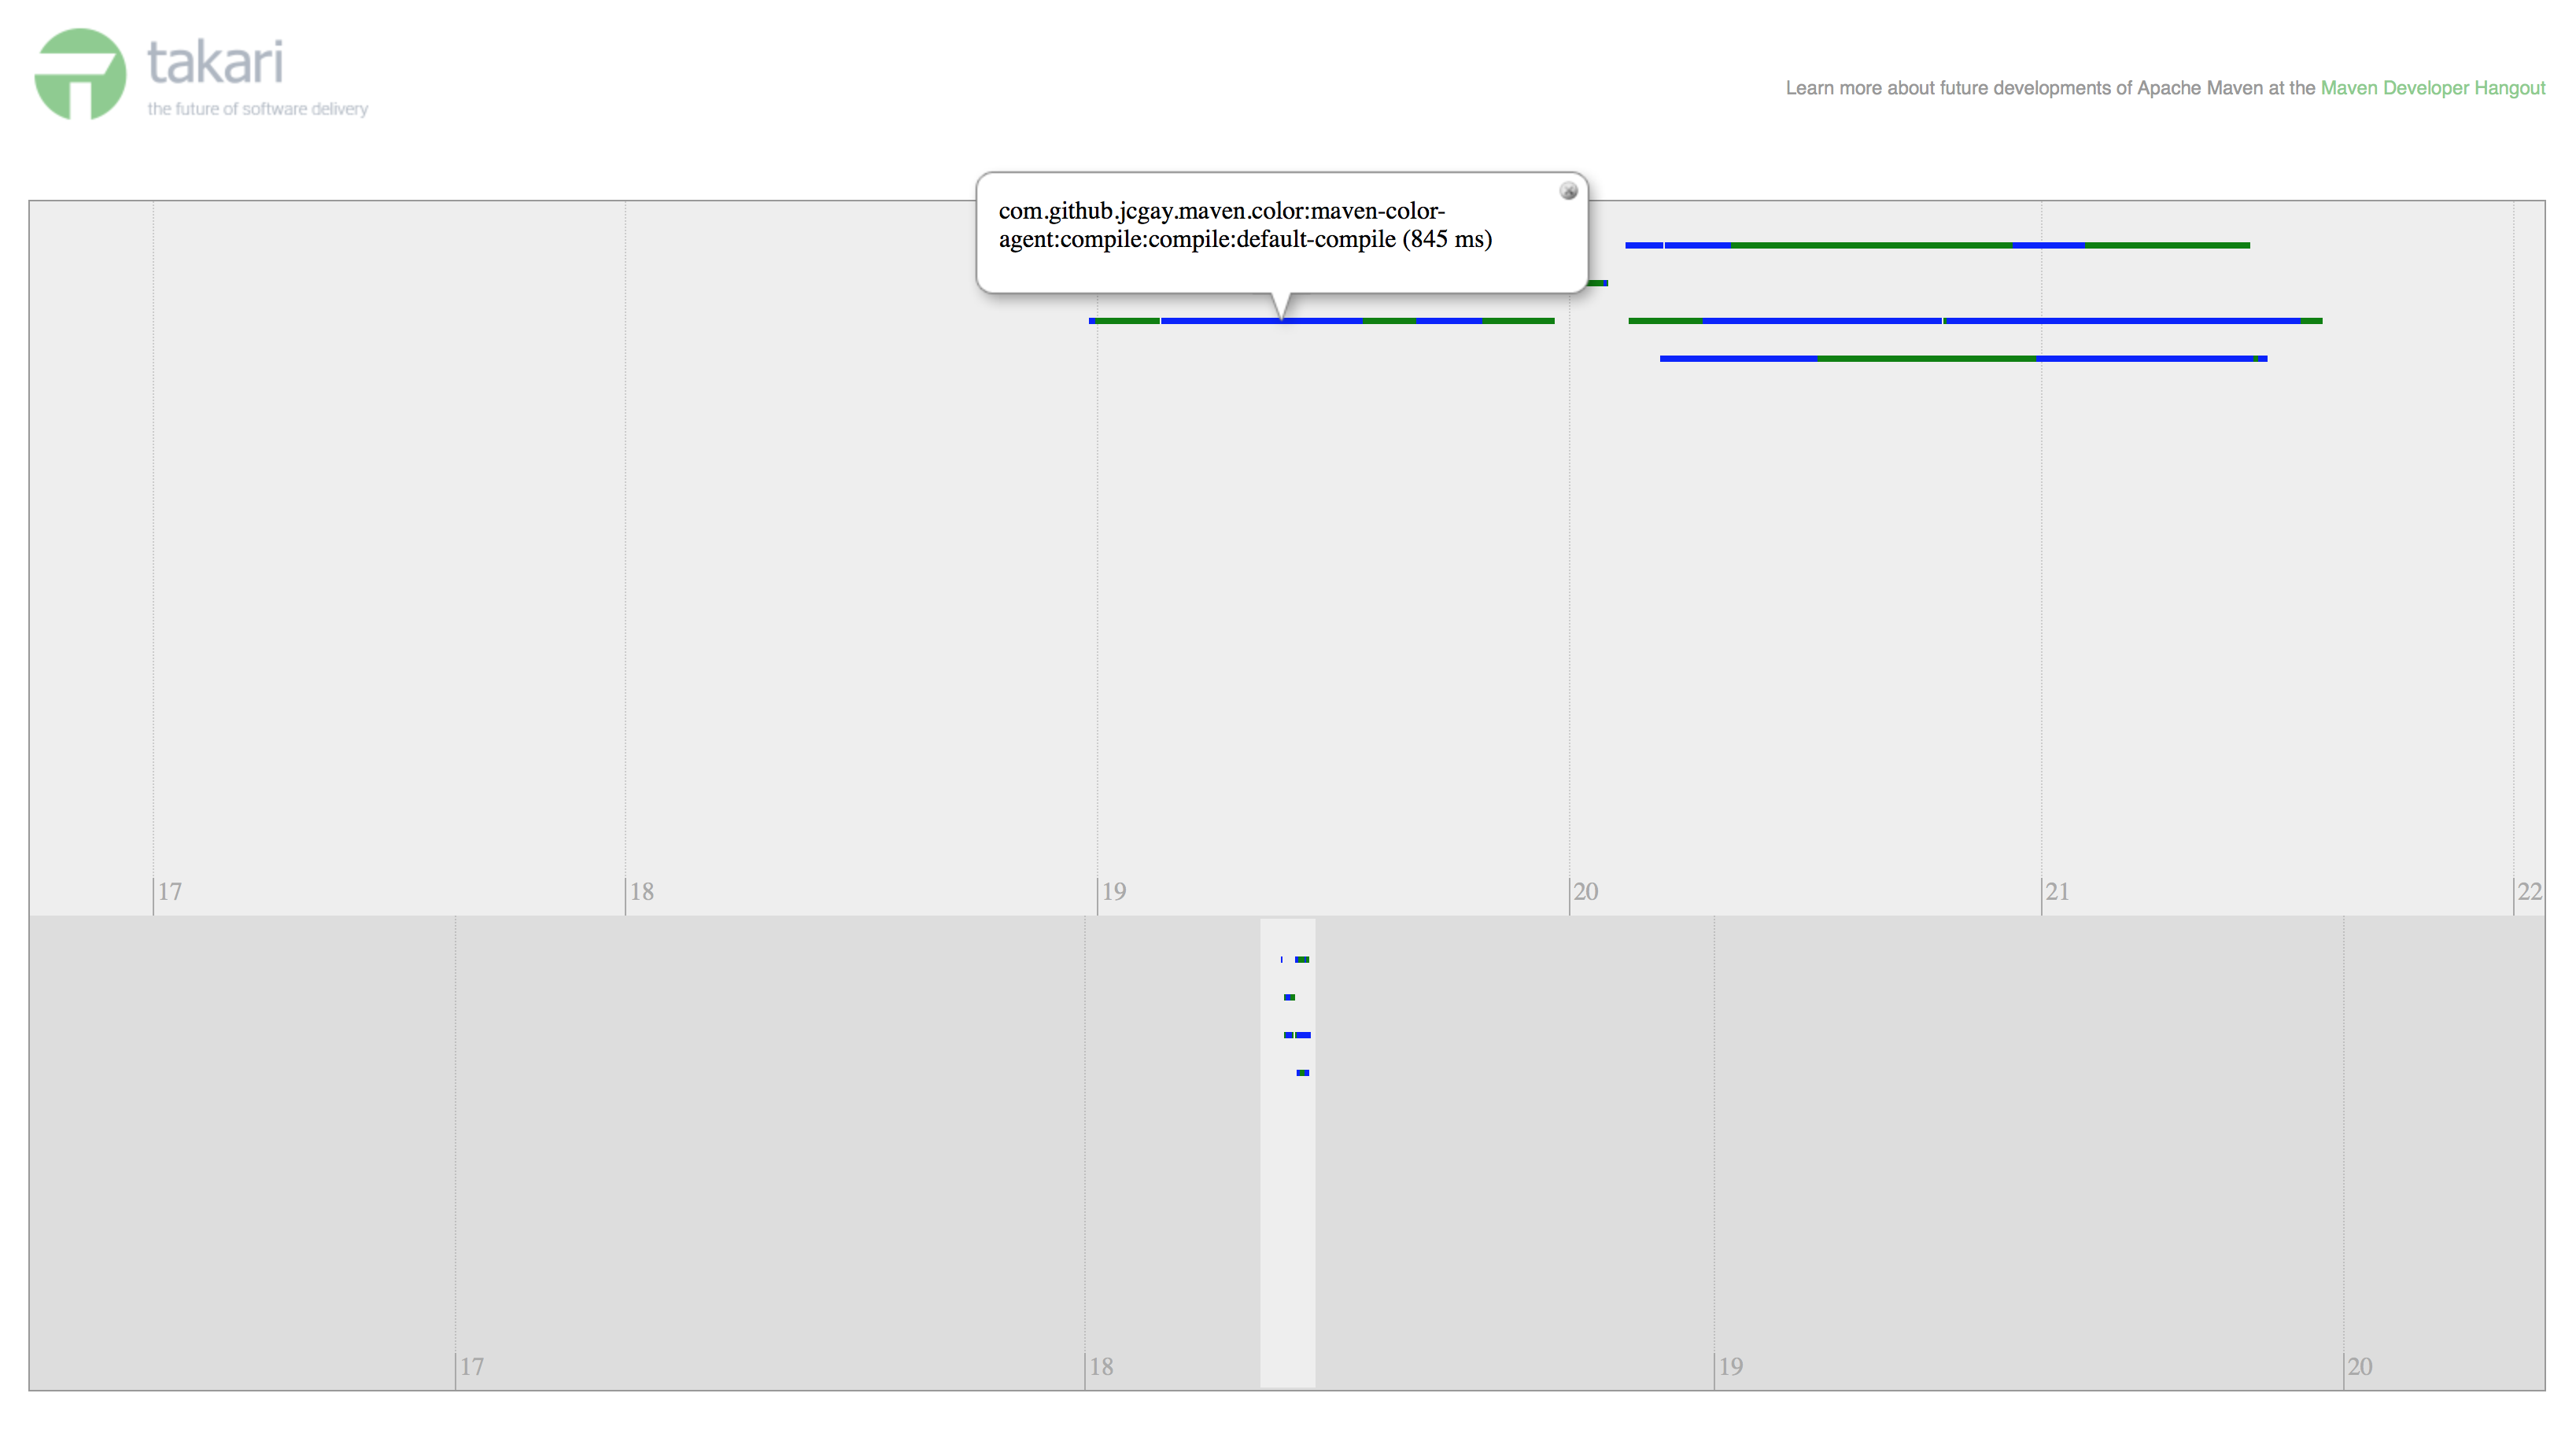
}maven-timeline
This plugin construct a timeline with execution times. Formely developed by David Gageot, it is now maintained by the takari team.
To use it add the following extension in your pom.xml:
<extension>
    <groupId>io.takari.maven</groupId>
    <artifactId>maven-timeline</artifactId>
    <version>1.6</version>
</extension>
Two reports are generated, HTML and JSON.
{
  "start": "2015-02-01T19:18:18.738Z",
  "end": "2015-02-01T19:18:21.770Z",
  "dateTimeFormat": "iso8601",
  "events": [
    {
      "start": "2015-02-01T19:18:20.940Z",
      "end": "2015-02-01T19:18:21.095Z",
      "duration": 2380,
      "description": "com.github.jcgay.maven.color:maven-color-logback:package:jar:default-jar (2380 ms)",
      "trackNum": 1,
      "color": "blue",
      "durationEvent": true
    },
    {
      "start": "2015-02-01T19:18:19.136Z",
      "end": "2015-02-01T19:18:19.545Z",
      "duration": 830,
      "description": "com.github.jcgay.maven.color:maven-color-core:compile:compile:default-compile (830 ms)",
      "trackNum": 2,
      "color": "blue",
      "durationEvent": true
    },
    {
      "start": "2015-02-01T19:18:19.562Z",
      "end": "2015-02-01T19:18:19.564Z",
      "duration": 849,
      "description": "com.github.jcgay.maven.color:maven-color-agent:test-compile:testCompile:default-testCompile (849 ms)",
      "trackNum": 3,
      "color": "blue",
      "durationEvent": true
    },
    {
      "start": "2015-02-01T19:18:19.677Z",
      "end": "2015-02-01T19:18:19.818Z",
      "duration": 1103,
      "description": "com.github.jcgay.maven.color:maven-color-agent:package:jar:default-jar (1103 ms)",
      "trackNum": 3,
      "color": "blue",
      "durationEvent": true
    },

    ...

    {
      "start": "2015-02-01T19:18:20.801Z",
      "end": "2015-02-01T19:18:21.549Z",
      "duration": 2834,
      "description": "com.github.jcgay.maven.color:maven-color-log4j2:package:single:make-assembly (2834 ms)",
      "trackNum": 3,
      "color": "blue",
      "durationEvent": true
    }
  ]
}
tesla-profiler
Another profiler displaying build times in the console output.
The report is displayed when we launch the build with the system property maven.profile:
mvn install -Dmaven.profile
Result example:
com.github.jcgay.maven:maven-profiler:2.2-SNAPSHOT

  clean 81ms
    org.apache.maven.plugins:maven-clean-plugin:2.6.1 (default-clean) 80ms

  validate 145ms
    org.apache.maven.plugins:maven-enforcer-plugin:1.2 (enforce-maven) 145ms

  process-resources 198ms
    org.apache.maven.plugins:maven-resources-plugin:2.7 (default-resources) 198ms

  compile 588ms
    org.apache.maven.plugins:maven-compiler-plugin:3.2 (default-compile) 588ms

  process-classes 209ms
    org.codehaus.plexus:plexus-component-metadata:1.6 (default) 209ms

  process-test-resources 3ms
    org.apache.maven.plugins:maven-resources-plugin:2.7 (default-testResources) 3ms

  test-compile 1s 2ms
    org.apache.maven.plugins:maven-compiler-plugin:3.2 (default-testCompile) 3ms
    org.codehaus.gmavenplus:gmavenplus-plugin:1.2 (default) 998ms

  test 2s 670ms
    org.apache.maven.plugins:maven-surefire-plugin:2.18 (default-test) 2s 669ms

  package 2s 778ms
    org.apache.maven.plugins:maven-jar-plugin:2.5 (default-jar) 250ms
    org.apache.maven.plugins:maven-source-plugin:2.4 (attach-sources) 270ms
    org.apache.maven.plugins:maven-shade-plugin:2.3 (default) 2s 258ms
Happy profiling !